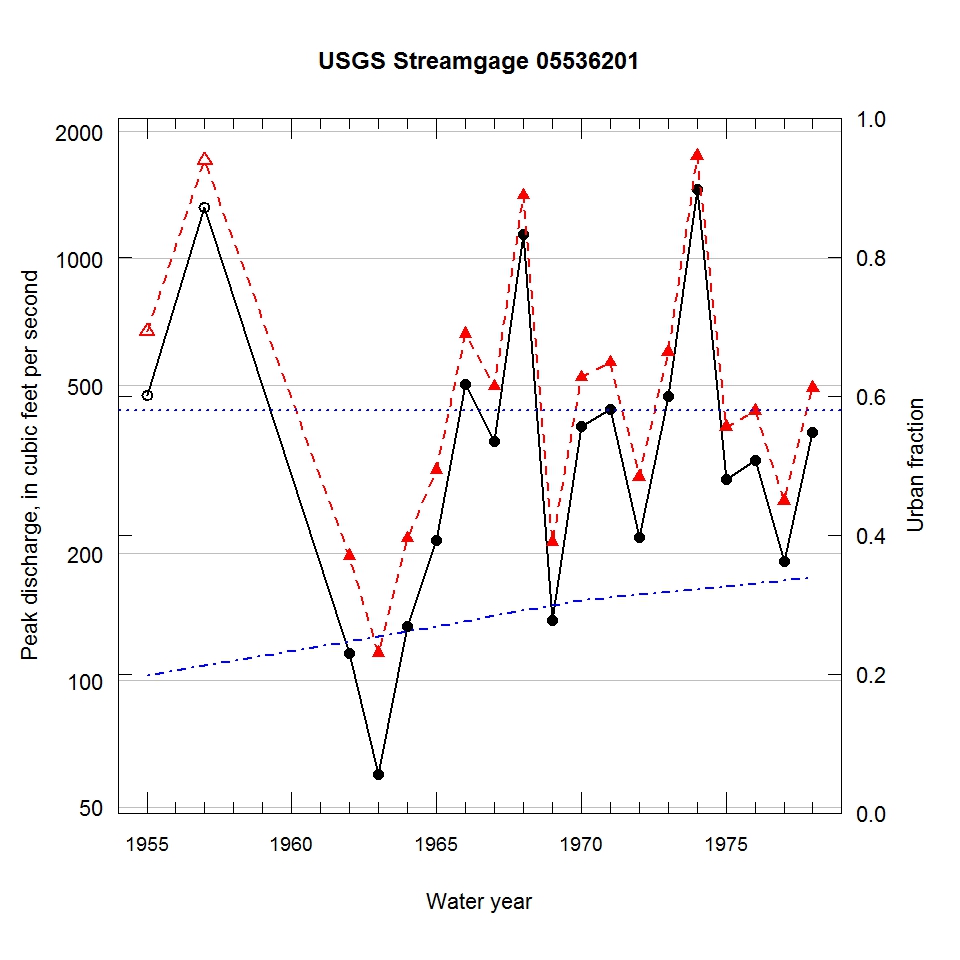
Observed and urbanization-adjusted annual maximum peak discharge and associated urban fraction and precipitation values at USGS streamgage:
05536201 THORN CREEK AT PARK FOREST, IL


| Water year | Segment | Discharge code | Cumulative reservoir storage (acre-feet) | Urban fraction | Precipitation (inches) | Observed peak discharge (ft3/s) | Adjusted peak discharge (ft3/s) | Exceedance probability |
| 1955 | 1 | 7 | 0 | 0.198 | 4.895 | 475 | 672 | 0.128 |
| 1957 | 1 | 7 | 0 | 0.212 | 2.540 | 1320 | 1710 | 0.006 |
| 1962 | 1 | -- | 0 | 0.247 | 0.215 | 116 | 197 | 0.911 |
| 1963 | 1 | 4B | 0 | 0.255 | 0.215 | 60 | 116 | 0.980 |
| 1964 | 1 | -- | 0 | 0.262 | 1.249 | 134 | 217 | 0.883 |
| 1965 | 1 | -- | 0 | 0.269 | 1.102 | 215 | 315 | 0.689 |
| 1966 | 1 | -- | 0 | 0.276 | 2.985 | 502 | 662 | 0.135 |
| 1967 | 1 | -- | 0 | 0.284 | 1.463 | 369 | 497 | 0.305 |
| 1968 | 1 | -- | 0 | 0.291 | 3.505 | 1140 | 1410 | 0.012 |
| 1969 | 1 | -- | 0 | 0.298 | 0.692 | 139 | 213 | 0.888 |
| 1970 | 1 | -- | 0 | 0.306 | 1.521 | 400 | 523 | 0.265 |
| 1971 | 1 | 2 | 0 | 0.310 | 1.371 | 440 | 567 | 0.207 |
| 1972 | 1 | -- | 0 | 0.314 | 1.255 | 218 | 304 | 0.714 |
| 1973 | 1 | -- | 0 | 0.318 | 1.241 | 472 | 601 | 0.178 |
| 1974 | 1 | -- | 0 | 0.322 | 2.976 | 1460 | 1750 | 0.006 |
| 1975 | 1 | -- | 0 | 0.326 | 1.657 | 300 | 399 | 0.497 |
| 1976 | 1 | -- | 0 | 0.330 | 2.199 | 332 | 435 | 0.421 |
| 1977 | 1 | -- | 0 | 0.335 | 1.656 | 191 | 266 | 0.794 |
| 1978 | 1 | -- | 0 | 0.339 | 1.354 | 387 | 494 | 0.311 |

